Cost
What Flooded Basement Cleanup Costs on Long Island
Every page ranking for this question gives you a range, and almost none of them says where it came from. There is a public record of what water damage has actually cost around here, it is more useful than a range, and it says something a range cannot.
Published August 31, 2026 By Oyster Bay Water Damage
The public record for this Town, from FEMA
4,658 claims
Flood insurance claims paid on properties in the Town of Oyster Bay as an NFIP community, for losses between 1978 and 2024, totalling $286,877,896.
FEMA, OpenFEMA NFIP Claims, dataset as of 2026-08-03, checked 2026-08-31$33,176
The median of those paid claims. The mean is $61,588, and the distance between the two numbers is most of what this post is about.
FEMA, OpenFEMA NFIP Claims, dataset as of 2026-08-03, checked 2026-08-3187.1%
The share of every flood insurance dollar ever paid here that came from one storm. Hurricane Sandy accounts for $250,011,646 of the total.
FEMA, OpenFEMA NFIP Claims, dataset as of 2026-08-03, checked 2026-08-31$7,137
The median paid claim for losses since 2013, across the 72 paid claims recorded here in the years after Sandy.
FEMA, OpenFEMA NFIP Claims, dataset as of 2026-08-03, checked 2026-08-31Search this and you will be given a range within about four seconds. Three to five thousand for a small job, ten to twenty for a bad one, more if it is finished. The ranges are broadly plausible and almost none of them says where it came from, which makes them impossible to argue with and impossible to rely on.
There is a different kind of answer available, and it is specific to this part of Long Island. FEMA publishes every flood insurance claim it has paid, down to the individual property, and the data can be filtered to the Town of Oyster Bay as its own community. That record does not tell you what a cleanup costs. It tells you something more useful, which is how wrong the idea of a typical figure is.
What the public record for this Town actually says
Filtered to the Town of Oyster Bay, FEMA's claims dataset holds 5,364 flood insurance claims for losses between 1978 and 2024. Of those, 4,658 resulted in a payment, and the payments come to $286,877,896 (FEMA, checked 2026-08-31).
The median of those paid claims is $33,176. The mean is $61,588.
Those two numbers describe the same set of payments and they are nearly twice apart, which is the first thing worth taking from any of this. When a mean sits that far above a median, the average is being dragged by a small number of very large values, and quoting it as what something usually costs is misleading in a specific direction: upward.
Then there is the reason the gap is so wide. Of the $286.9 million paid out here across almost fifty years, $250.0 million came from Hurricane Sandy. One storm in October 2012 accounts for 87.1 per cent of every flood insurance dollar ever paid in this Town, across 2,578 paid claims, with a median of $77,679 (FEMA, checked 2026-08-31).
Take Sandy out and the picture changes completely. For losses from 2013 onward there are 72 paid claims on the record, and their median is $7,137, with a mean of $16,630 (FEMA, checked 2026-08-31).
So the honest summary of half a century of insured flood losses in this Town is that an ordinary year produces a small number of claims with a median around seven thousand dollars, and that roughly once a generation something happens that is ten times worse and produces more than the previous thirty years put together.
That is not a price list. It is a much better description of the risk than any range, and it explains why the ranges disagree with each other so violently: they are averaging across two entirely different populations of event.
What this record does not measure, which matters as much
A number is only useful if you know what it counts, and this one has four real limits. None of them is hidden, and all four are the reason this post cannot end with a figure for your basement.
It is flood only. The NFIP pays flood claims, and a flood has a narrow published definition. A supply line that let go, a hot water tank that failed, an appliance that emptied itself into a finished basement, a drain that backed up: none of those is in this dataset at all, and between them they are the majority of wet basements. What you are looking at is the subset of water losses that arrived from outside the building.
It is what was paid, not what the work cost. A claim payment is settled after the deductible comes off and inside the policy limits. A loss larger than the coverage shows up here at the coverage amount. The relationship between these numbers and a contractor's invoice is real but loose.
It is insured properties only. A house with no flood policy that took four feet of water in 2012 appears nowhere in this record. That has a direction: the dataset understates how many properties flooded and says nothing at all about what the uninsured ones spent.
And it is nominal dollars spread across decades. A 1985 payment and a 2024 payment are added together as written. Over a period this long that flatters the older half of the record, which is one more reason the post-2013 figure is the more useful one for thinking about today.
There is a fifth thing that looks like a finding and is partly an artefact, which is worth saying out loud because it would be easy to make a meal of it. Of the 5,364 claims, 4,955 come from a single ZIP code on the south shore, which is 92.4 per cent of them (FEMA, checked 2026-08-31). That is a real concentration, and it says less about where water goes than it first appears. Flood insurance is required with a federally backed mortgage inside the mapped high-risk zones, and those zones here are overwhelmingly along the south shore bays. So the record shows where flood policies are held at least as strongly as it shows where basements get wet. The north shore's water problems are real and are mostly outside this dataset, which is its own kind of information.
Why the same job costs different amounts on the two sides of this Town
The Town runs from the Sound down to the bays, and the ground underneath those two halves behaves differently enough that it changes what the work is.
On the north side the land falls toward the water and the material under it is mixed. Water arrives at a building from uphill, during weather, and finds a way in at a particular place: a window well, a cellar entrance, a gap at the footing. The cleanup there is usually bounded, because the source stops when the rain does. The expensive part is often not the cleanup at all, it is the work that stops it happening again, and that work is outside rather than inside.
On the south side the ground is flat and the water table sits close under it. Water rises through the slab and the base of the walls rather than pouring in at one point, and the supply of it does not switch off when the sky clears. Two things follow for the bill. The drying takes longer, because the source has not actually been switched off, and equipment on hire is a daily cost. And the recurrence problem is a drainage project rather than a repair, which is the single widest variable anywhere in this subject.
That is why a range quoted for Long Island as a whole is doing something questionable. It is averaging a bounded job over a slope with an unbounded one over a water table, and reporting the middle as though it described either.
What actually moves the number
Setting aside the water, five things do most of the work, and they are the ones a contractor is trying to establish while they walk around.
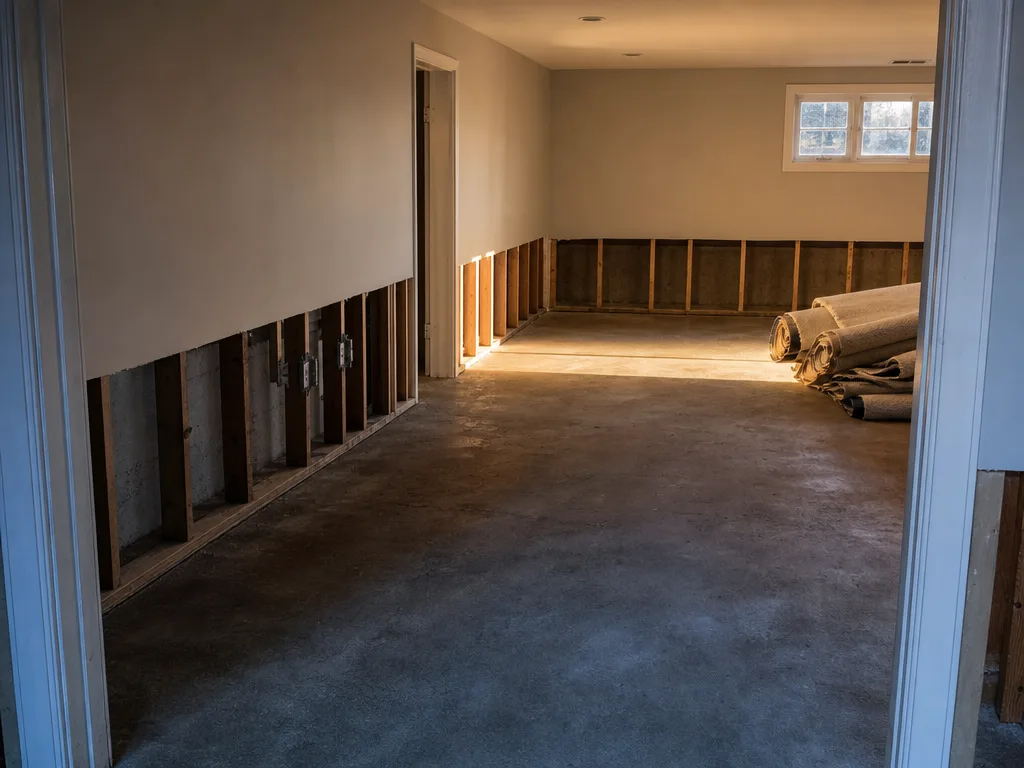
What is down there. Finish is the whole game. A basement with a painted concrete floor, block walls and shelving is a drying job. A basement with carpet, an underlay, stud walls, insulation and a ceiling is a demolition job followed by a drying job followed by a rebuild, and the rebuild is usually the largest of the three. Floor area barely moves this. Materials move it enormously.
How long it was wet. This is the variable most under your control and the one people discover late. Wet material that dries quickly can often stay. Wet material that has been sitting comes out. How long before mold grows after water damage covers what the published window does and does not promise, and the short version is that speed changes what is salvageable rather than starting a clock.
What was in the water. Clean water from a supply line, ground water, and anything from a drain are three different jobs with different rules and different protective requirements. The category changes what can be cleaned and what has to be discarded, and it changes it regardless of how long ago it happened.
How long the equipment stays. Drying is billed by the day, with air movers and dehumidifiers sitting in the room, and the number of days is decided by the materials and by whether the source is genuinely closed off. This is where a quote and an invoice most often diverge, and where asking what happens if the readings are not down on schedule is a fair question rather than a suspicious one.
Whether one firm or three do it. Extraction, drying and reconstruction are sometimes one contract and sometimes three, and a quote covering one of them looks dramatically cheaper than a quote covering all three. A great many comparisons that seem to show a large price difference are actually comparing different scopes.
The contents question is worth a line of its own, because the record has something to say about it. Of everything paid out here, $251.2 million went on buildings and $35.7 million on contents, so contents are 12.4 per cent of the total (FEMA, checked 2026-08-31). Insurance and repair are not the same thing, but the proportion is a reasonable corrective to the instinct that the furniture is the loss. Mostly, the building is.
Where the national figures fit, and where they do not
It is worth knowing the scale of the thing, if only to see how little a national number tells you about a house.
FEMA reports that floods caused more than $8 billion of damage to homes and businesses nationwide in 2024, and that $3.8 billion of that occurred in communities not considered high risk (FEMA, checked 2026-08-31).
Neither number tells you anything about a basement. What they are good for is calibration: the second one is roughly forty-four per cent of the first, which means that in an ordinary year a large share of the national bill is picked up by households who had been told their area was not the problem. That is the population most likely to be reading a cost page with no flood policy in the drawer, and what a New York homeowners policy actually covers matters more to their final figure than any range on this page.
Checking any of this yourself
Everything above is derived from a public dataset, and one of the advantages of that is you do not have to take it on trust.
FEMA puts the same claims data behind a lookup where you can select a state and a county and see the dollars paid and the number of claims over any period you choose (FEMA, checked 2026-08-31). Nassau County as a whole holds 51,520 claims against this Town's 5,364, which is a reasonable sanity check on the scale of what you are reading here.
The Town-level figures in this post come from FEMA's API rather than that page, because the lookup works by county and this Town is a community inside one. The script that produces them lives in this site's repository, runs against the live API with no key and no account, and prints the dataset's own as-of date beside the results so that a figure which has moved is visible as having moved. The version in this post was run against the dataset as published on 3 August 2026.
Keeping your own number down
If your basement is wet right now, cost is the wrong first question, and the right one is whether it is safe to go down there. Federal guidance is to avoid wading in floodwater, which can be contaminated and can hide debris, and not to touch electrical equipment that is wet or while standing in water, turning the power off first only where that can be done safely (FEMA, checked 2026-08-31).
After that, the order that keeps the number down is unglamorous: stop the source, get the water out, and start drying the same day rather than the next one. What that involves is set out on flooded basement cleanup, and where the water came in because weather opened the building up, storm damage restoration is the closer description of the repair.
Then get more than one quote, and make them comparable before you compare them. Ask for extraction, drying and reconstruction as separate lines. Ask what is being removed rather than dried, and why the line was drawn where it was. Ask how many days the equipment is staying and what the plan is if the readings are not where they should be. A quote that cannot be broken into those parts is not cheaper, it is less specific.
And treat any figure you are given before somebody has looked at the room as what it is, which is a guess with a decimal point on it. This page has published every number it can stand behind, and none of them is the cost of your basement.
Questions people ask
What is the average cost to clean up a flooded basement?
There is no published average for the cleanup work itself, and the averages you will find are usually national figures assembled by lead brokers rather than measurements. What is published is what insurers paid on flood losses, and even there the average is misleading: the mean paid claim in this Town is $61,588 and the median is $33,176 (FEMA, checked 2026-08-31), because a handful of very large losses pull the mean upward.
How much does it cost to have water pumped out of your basement?
Extraction is usually the smallest line on the job and the one people expect to be the biggest. It is a few hours of work. The drying that follows runs for days and involves equipment sitting in the room the whole time, and the reconstruction afterwards is normally the largest number of the three.
Does the size of the basement decide the price?
Less than you would think. What is in it matters more than how big it is, because the cost sits in the materials that have to come out and go back rather than in the floor area. An unfinished basement with a painted concrete floor and a finished one of identical size are not close.
How can I quickly dry out my basement after a flood?
Safety decides the order, not speed. Do not go into a basement holding standing water if there is any chance the power is still on to that space: federal guidance is not to touch electrical equipment that is wet or while standing in water, and to cut the power first only where that can be done safely (FEMA, checked 2026-08-31). Once that is settled, extraction and then continuous air movement across the wet materials is what shortens the job, and every day it is shortened by is a day of equipment hire that does not appear on the invoice.
Will homeowners insurance cover basement water damage?
Often not, and the reason is a definition rather than a judgement about your loss. Cover turns on a published test that most people have never read, and a great many wet basements fall outside it. How a New York homeowners policy treats water damage works through that test.
What should I ask for so quotes are comparable?
Ask each contractor to separate extraction, drying and reconstruction, to say what is being removed rather than dried and why, to say how many days the equipment stays and what happens if the readings are not down by then, and to say who puts the room back. Two quotes that look thousands apart are frequently quoting three, two and one of those things.
You want a number for your own basement
Nothing on this page can give you one, and anybody quoting from a description is guessing. What settles it is somebody standing in the room. Send a description of the space, how far the water got and what the floors and walls are made of, and a restoration contractor working in the Town of Oyster Bay can arrange to come and measure it.
Get a quoteServing the Town of Oyster Bay, NY
The work this guide is about
- Flooded Basement Cleanup
Water out, then the structure dried and checked.
- Storm Damage Restoration
The envelope closed first, then the water dealt with inside.
- All restoration services
Where these figures come from, and how to check them
The claims figures are derived rather than quoted, so the derivation is published with them. FEMA also puts the same dataset behind a county lookup anyone can use, and the script in this site's repository re-runs the whole calculation against the live API.
- FEMA OpenFEMA dataset: NFIP Claims (v3 API) Checked 2026-08-31
- FEMA, National Flood Insurance Program Historical NFIP Claims Information and Trends Checked 2026-08-31
- FEMA, National Flood Insurance Program The Cost of Flooding Checked 2026-08-31
- FEMA Floods (Ready.gov) Checked 2026-08-31